Published · Updated
Your growing season is the stretch of days between your last spring freeze and your first fall freeze. NOAA lists it as the “freeze-free period” at 36°F, 32°F and 28°F. The count changes with the cold line you pick and the risk you accept, so one town has several honest answers.
Last verified: November 11, 2026. Every number below comes from NOAA station tables or university extension pages that were opened and read on that date. The sources are listed at the end.
This page shows how to read that number, using two Minnesota stations as real examples. You will see how much the cold line matters, which line fits which crop, and why subtracting two dates gives a different answer than NOAA’s own day count.
What is a freeze-free period?
A freeze-free period is the number of days between the last cold night in spring and the first cold night in fall. The National Centers for Environmental Information (NCEI), part of NOAA, works it out for each weather station from 30 years of records. Those 30-year averages are called climate normals. The tables used on this page cover 1991 to 2020, according to NOAA Climate.gov (2025).
The tables use temperature lines from 36°F down to 16°F in steps of 4°F, says NC State Extension (reviewed 2024). Three lines matter for most gardens: 36°F for frost, 32°F for a freeze and 28°F for a hard freeze. The Western Regional Climate Center adds that a frost-free period is one where the daily low stays above 36°F. If those terms blur together, read frost versus freeze first.

How much do the 36°F, 32°F and 28°F lines change the count?
A lot. At the Minneapolis station below, the median season is 154 days at 36°F and 195 days at 28°F. That is 41 more days, almost six weeks, from changing one number.
| Station | 36°F | 32°F | 28°F |
|---|---|---|---|
| Minneapolis, Lower St. Anthony Falls (754 ft) | 154 days | 175 days | 195 days |
| Rochester International Airport (1,304 ft) | 140 days | 159 days | 180 days |
Both stations are in Minnesota, yet Rochester runs 14 to 16 days shorter on every line. The tables list the elevations shown above, but they do not say why the counts differ. Elevation may play a part, though that is a guess. The Western Regional Climate Center says local terrain has the strongest effect on lows near the ground, and that narrow valleys and enclosed basins get cold air drainage most often. Your own yard can differ from the nearest station for the same reason. Garden microclimates shows how to check.
Which line should you count to for your crops?
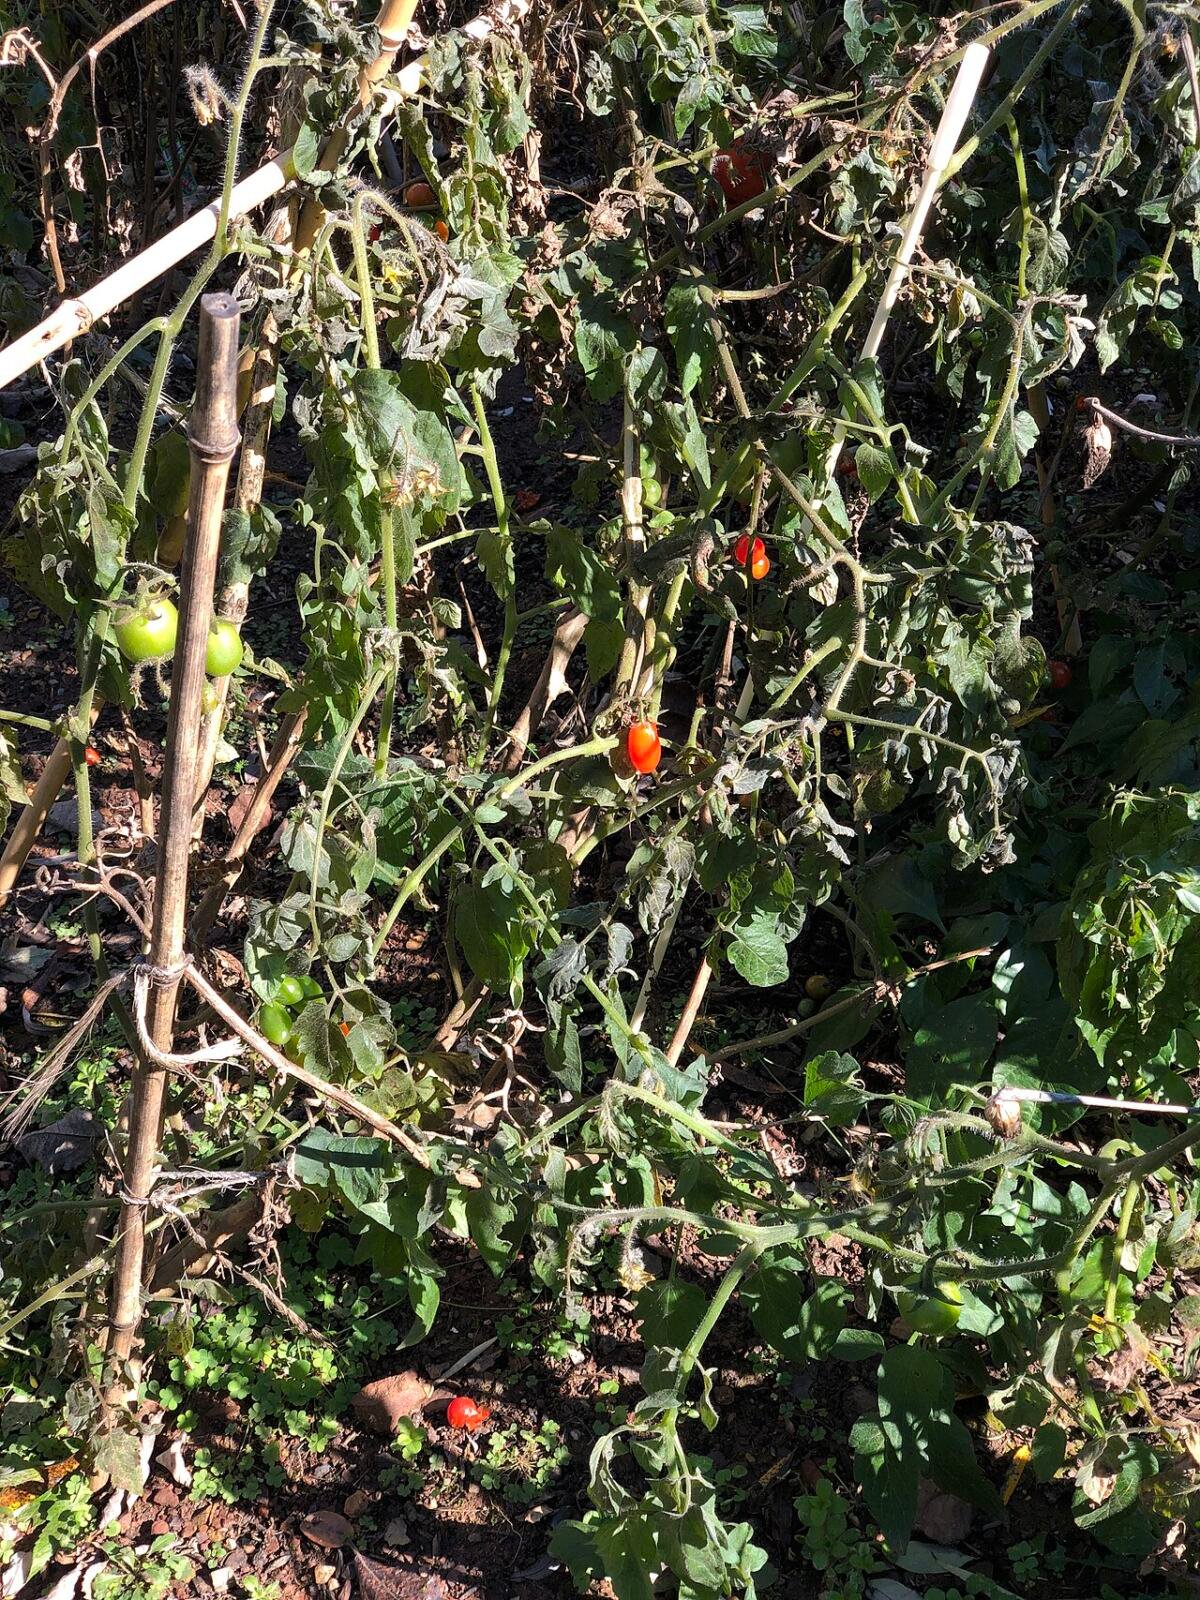
Match the line to what the plant can take. Purdue Extension sorts vegetables into three groups. The Western Regional Climate Center describes what each freeze level does: a light freeze (29 to 32°F) kills tender plants, and a moderate freeze (25 to 28°F) damages most vegetation widely.
| Group (Purdue) | Examples | Count days at | Why |
|---|---|---|---|
| Tender | Tomato, pepper, bean, squash, cucumber, sweet corn | 32°F, or 36°F if you will not cover | Damaged by light frost |
| Semi-hardy | Carrot, lettuce, beet, potato | 28°F as the outer edge | Tolerate light frost, but a moderate freeze hurts |
| Hardy | Kale, broccoli, cabbage, pea, onion, spinach | 28°F or lower | Tolerate hard frost |
Extension lists do not agree on every crop. The frost versus freeze post compares two of them. Treat this table as a starting point and keep your own notes on what survives in your yard.
How do you read the 10%, 50% and 90% columns for days?
Start with what the percent means. NC State Extension explains that a 10% level means the event is expected in about 1 year out of 10, and a 90% level means about 9 years out of 10. For day counts, the table shows the chance of a run longer than the number listed.
At Minneapolis and 32°F, the 1991–2020 table shows 192 days at 10%, 175 at 50% and 155 at 90%. In about 9 years out of 10, the freeze-free run beat 155 days. In only about 1 year out of 10 did it beat 192.
That flips the usual advice about dates. For dates, the cautious column is 10%. For days, the cautious column is 90%. NC State uses the same logic and gives a Raleigh example from older 1981–2010 data: at 28°F it lists 278 days at 10%, 252 at 50% and 226 at 90%.
- 90% column: the safe count. Use it for crops you cannot afford to lose.
- 50% column: the middle count. Half of years run shorter. It suits crops you can cover.
- 10% column: the bold count. Only about 1 year in 10 is this long.
How do you find your own growing season length?
- Find the NOAA freeze and frost table for the station nearest you. Your state climate office or a regional climate center may host it.
- Pick the temperature row that fits your crop: 32°F for tender plants, 28°F for hardy ones.
- Read the freeze-free row at the 90% column for a safe plan, or 50% for a middle plan.
- Compare that number with the days to maturity on your seed packet.
- Adjust for your yard. Low spots run colder, and warm walls run milder.
GardenClock’s frost date lookup shows median dates for supported stations, and the data sources page explains where they come from.
What does a worked example look like at Minneapolis?
The table below uses the 32°F line, the one that matters for tender crops. The last column is NOAA’s own freeze-free row.
| Planning style | Last spring freeze after | First fall freeze before | NOAA freeze-free days |
|---|---|---|---|
| Cautious | May 7 | October 2 | 155 |
| Middle | April 23 | October 16 | 175 |
| Bold | April 10 | October 30 | 192 |
Now subtract the dates yourself, and the answers drift. May 7 to October 2 is 148 days, which is 7 fewer than NOAA’s 155. April 10 to October 30 is 203 days, which is 11 more than NOAA’s 192. Only the middle pair lines up: April 23 to October 16 is 176 days against 175. These are my own calculations. The tables do not explain the gap. A likely cause is that a very late spring freeze and a very early fall freeze rarely land in the same year. The safe habit is to use the freeze-free row and skip the date subtraction.
Now add a crop. Say a tender crop needs 110 days from transplant to the end of picking. These numbers are invented for the example. That leaves 45 spare days on the cautious count (155 minus 110), 65 on the middle count and 82 on the bold count. If an early freeze would wipe out the crop, plan on the cautious count. If you can cover plants on cold nights, the middle count is fair.
Skip the long math if every crop you grow matures in well under 70 days. That is a judgment call, not a sourced rule, but the season will rarely be the limit for those crops.
What happens outside the freeze-free window?
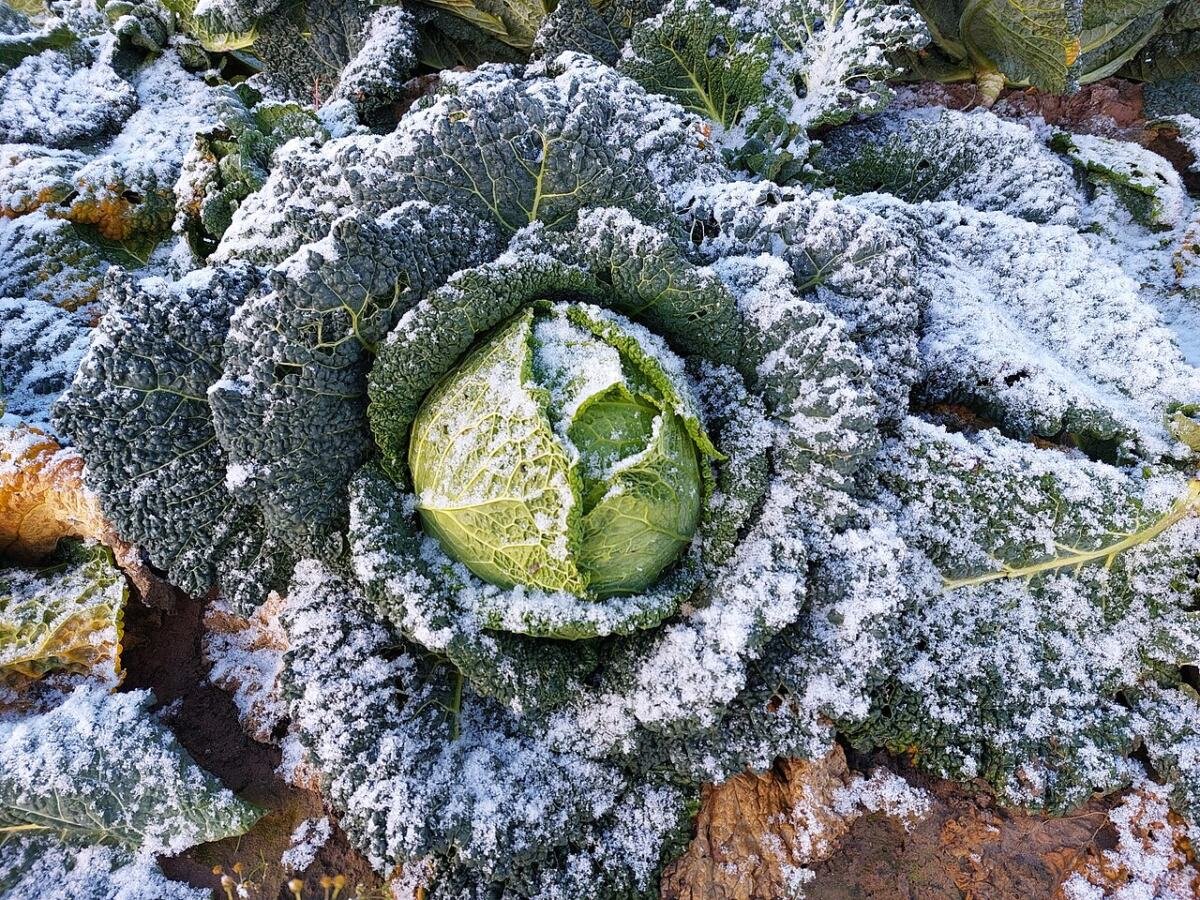
The window is not a wall. Purdue Extension notes that Indiana often has several more weeks of good growing weather after the first frost, and that hardy vegetables tolerate several hard frosts. Blankets or cloths held up by stakes protect beds. Single plants can wear paper caps or milk jugs. A cold frame stretches the season further. For fall dates, see when to plant a fall garden.
Does a long season mean you can plant earlier?
No. The freeze-free count measures cold nights in the air. It does not measure soil, which has its own targets for each crop. Read why soil temperature matters more than a warm afternoon before you sow. To fit seed starting into the count, work backward with when to start seeds indoors. Your hardiness zone is a different number again. It tracks winter lows, not season length, as frost date vs hardiness zone explains.
What are the common mistakes?
- Comparing counts from two sites without checking the temperature line and the years.
- Taking a spring date from one column and a fall date from another, then subtracting.
- Using the 50% count for a crop that cannot take a freeze.
- Treating the nearest station as if it were your yard.
- Reading a long season as permission to sow in cold soil.
Frequently asked questions
What is the difference between a growing season and a freeze-free period?
A growing season is the loose idea of the months when plants can grow. A freeze-free period is a number: the days between the last cold night in spring and the first one in fall, using a set temperature such as 32°F. NOAA publishes that number for each station.
Which temperature should I use to count frost-free days?
Use 32°F for frost-tender crops such as tomatoes, beans and squash. Use 36°F if you will not cover plants on a clear, calm night. Use 28°F for hardy crops such as kale and cabbage. NOAA tables list all three.
How do I know if my crop fits the season?
Read days to maturity on the seed packet. Compare it with the freeze-free days at your station, using the 90% figure for a safe plan. If the crop needs more days than that, start seeds indoors or pick a faster variety.
Why do frost-free day counts differ between websites?
Sites may use different temperature lines, different probability levels or different 30-year periods. The NC State guide uses 1981 to 2010 data, while the Minnesota tables here use 1991 to 2020. Check the line, the probability and the years before you compare two sources.
Is a freeze-free period a forecast?
No. It is a statistic built from 30 years of past records. NC State Extension calls the values best guesses based on past trends. Check the local forecast before you set out or cover tender plants.
Where can I find the table for my station?
Look for your state climate office, since some host NOAA station tables, as the Minnesota DNR does. NC State also points to the Midwestern and Southeast Regional Climate Centers. GardenClock’s frost date lookup shows median dates for supported stations.
Sources
All pages were opened and read on November 11, 2026. Gardening results vary by site; see the editorial policy.
- NOAA NCEI, Summary of Annual Normals 1991–2020, Lower St. Anthony Falls, MN (hosted by the Minnesota DNR, generated May 2, 2024)
- NOAA NCEI, Summary of Annual Normals 1991–2020, Rochester International Airport, MN (hosted by the Minnesota DNR, generated May 2, 2024)
- NC State Extension, AG-873, Interpreting Freeze / Frost Probabilities from NCEI (Nelson, El-Khoury and Boyette; published February 28, 2020; reviewed December 11, 2024)
- Western Regional Climate Center, Climate and Weather Glossary: Freeze/Frost Probabilities
- NOAA Climate.gov, Average date of last spring freeze (Rebecca Lindsey, April 17, 2025)
- Purdue Extension, HO-66, The Fall Vegetable Garden (B. Rosie Lerner; page last modified May 20, 2026)
Published by Sajib Saha, a web developer and SEO specialist. This guide is compiled from the extension and NOAA sources named above, not from personal horticultural credentials. See About and our editorial policy.